
A finance team once asked me for a report that looked simple on paper: one line per product, with four columns for Q1 through Q4. Their database stored sales the way databases should, with one row per product per quarter. An analyst had been exporting the data to Excel and rebuilding the layout by hand every month. When a quarter was missing for one product, the copy-and-paste shifted a column and the numbers landed under the wrong heading for two weeks.
This is the classic reason to convert rows into columns in SQL. The database holds narrow, tall data, and reports want wide, flat data. SQL Server gives you three solid ways to do it: the PIVOT operator, conditional aggregation with CASE, and dynamic SQL when the columns are not known in advance. This guide builds each one, explains the trade-offs, and covers NULLs, performance, and secure reporting in SQL Server and Azure SQL Database.
What “Rows Into Columns” Means
Turning rows into columns is called pivoting. You take the distinct values from one column, such as Q1, Q2, Q3, and Q4, and turn each into its own column heading. At the same time, you aggregate, which means combine many rows into one value with a function like SUM, so each cell of the new grid holds a single number.
Every pivot has three parts:
- Row identifier: the column that stays as rows, such as
Product. - Pivot column: the column whose values become headings, such as
Quarter. - Value column: the data that fills the cells, such as
Revenue, with an aggregate.
The opposite operation, turning columns back into rows, is called unpivoting; see SQL UNPIVOT.
Pro Tip: In my experience, I write down those three parts on paper before touching the keyboard. Nearly every broken pivot I have debugged was missing a clear answer to “which column becomes the headings?”
Create a Practice Table
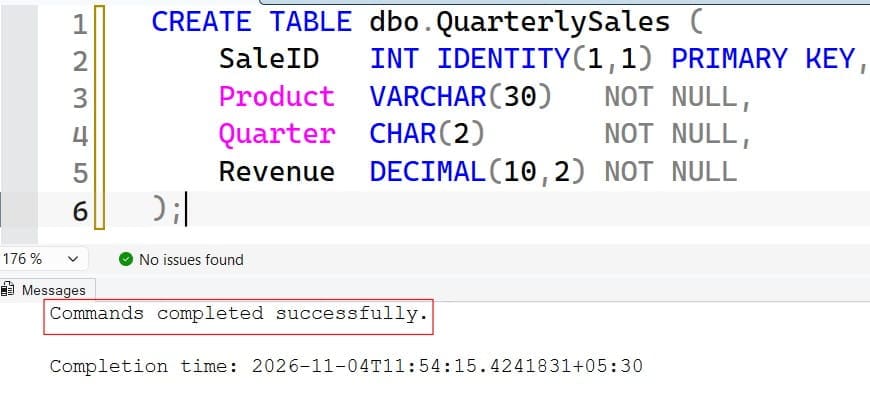
A schema is the structure of your tables. Use a small sales table with realistic gaps and a duplicate.
CREATE TABLE dbo.QuarterlySales (
    SaleID   INT IDENTITY(1,1) PRIMARY KEY,
    Product  VARCHAR(30)   NOT NULL,
    Quarter  CHAR(2)       NOT NULL,
    Revenue  DECIMAL(10,2) NOT NULL
);

INSERT INTO dbo.QuarterlySales (Product, Quarter, Revenue)
VALUES
 ('Laptop',  'Q1', 100.00), ('Laptop',  'Q1',  20.00),
 ('Laptop',  'Q2', 120.00), ('Laptop',  'Q3',  90.00), ('Laptop', 'Q4', 150.00),
 ('Monitor', 'Q1',  60.00), ('Monitor', 'Q3',  70.00), ('Monitor', 'Q4',  80.00),
 ('Dock',    'Q2',  30.00), ('Dock',    'Q3',  40.00);
After executing the above query, I got the expected output as shown in the screenshot below.
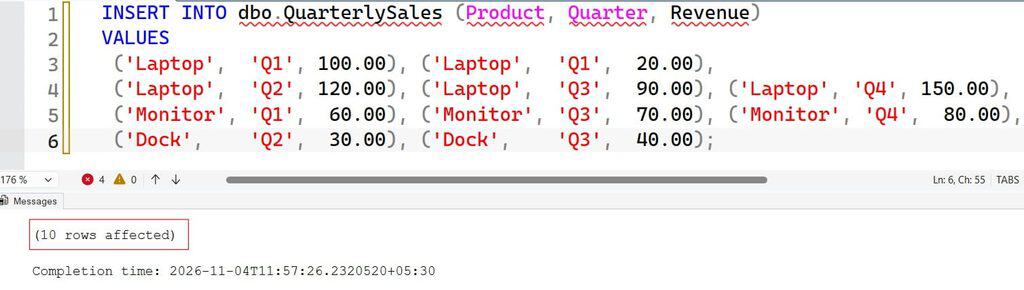
Run this only in a test database, because it inserts rows. Notice three deliberate details. Laptop has two Q1 rows that must be added together. Monitor has no Q2 row. Dock has no Q1 or Q4 rows. The expected wide result is:
| Product | Q1 | Q2 | Q3 | Q4 |
|---|---|---|---|---|
| Dock | NULL | 30 | 40 | NULL |
| Laptop | 120 | 120 | 90 | 150 |
| Monitor | 60 | NULL | 70 | 80 |
How to Convert Rows Into Columns in SQL With PIVOT
The PIVOT operator is built into T-SQL for this job. It works in SQL Server and Azure SQL Database.
SELECT Product, [Q1], [Q2], [Q3], [Q4]
FROM (
    SELECT Product, Quarter, Revenue
    FROM dbo.QuarterlySales
) AS src
PIVOT (
    SUM(Revenue)
    FOR Quarter IN ([Q1], [Q2], [Q3], [Q4])
) AS p
ORDER BY Product;
Here is what each piece does:
- The inner query (
src) selects only the three columns the pivot needs. This matters a lot, and we come back to it below. SUM(Revenue)is the aggregate that fills each cell. Laptop’s two Q1 rows add up to 120.FOR Quarter IN (...)names the pivot column and lists the values that become headings. You must list them by hand. Square brackets are required for names that contain spaces or start with a digit.AS pgives the pivot result an alias, which SQL Server requires.
After executing the above query, I got the expected output as shown in the screenshot below.
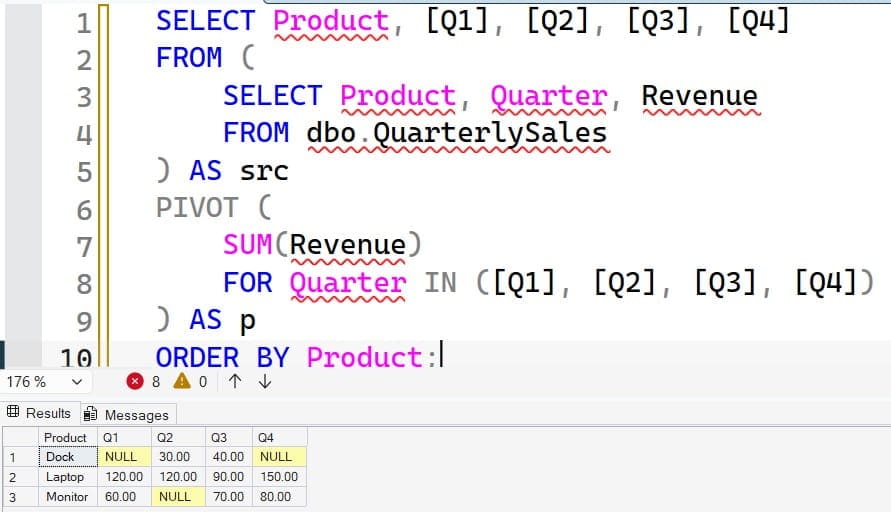
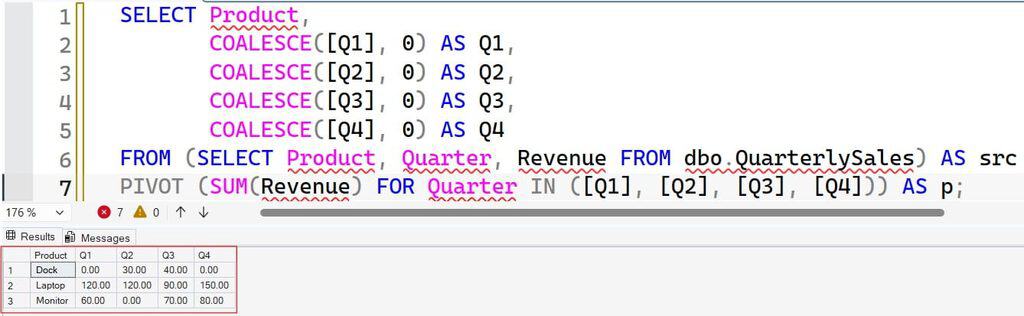
The output matches the table above. Missing combinations, like Monitor Q2, appear as NULL because no row existed to aggregate. A NULL is a missing or unknown value, not zero. To show zeros, wrap each column with COALESCE, which returns the first non-NULL value; see the COALESCE function and how SQL handles NULL.
SELECT Product,
       COALESCE([Q1], 0) AS Q1,
       COALESCE([Q2], 0) AS Q2,
       COALESCE([Q3], 0) AS Q3,
       COALESCE([Q4], 0) AS Q4
FROM (SELECT Product, Quarter, Revenue FROM dbo.QuarterlySales) AS src
PIVOT (SUM(Revenue) FOR Quarter IN ([Q1], [Q2], [Q3], [Q4])) AS p;
After executing the above query, I got the expected output as shown in the screenshot below.
The Hidden-Column Trap
PIVOT groups by every column in the source that is not the pivot column or the value column. If you write SELECT * FROM dbo.QuarterlySales PIVOT (...), the unique SaleID becomes part of the grouping, and every row ends up on its own line with mostly NULLs. Always use a subquery that selects only the columns you need, as shown above.
Pro Tip: I once debugged a report that returned ten times too many rows because someone added a
LastModifiedcolumn to the source. Selecting exactly three columns in the inner query protects you from that kind of drift.
Method 2: Conditional Aggregation With CASE
You can get the same result with ordinary GROUP BY and CASE. This is called conditional aggregation: each column sums only the rows that match its heading. See the CASE statement, the SUM function, and GROUP BY.
SELECT
    Product,
    SUM(CASE WHEN Quarter = 'Q1' THEN Revenue ELSE 0 END) AS Q1,
    SUM(CASE WHEN Quarter = 'Q2' THEN Revenue ELSE 0 END) AS Q2,
    SUM(CASE WHEN Quarter = 'Q3' THEN Revenue ELSE 0 END) AS Q3,
    SUM(CASE WHEN Quarter = 'Q4' THEN Revenue ELSE 0 END) AS Q4
FROM dbo.QuarterlySales
GROUP BY Product
ORDER BY Product;
After executing the above query, I got the expected output as shown in the screenshot below.
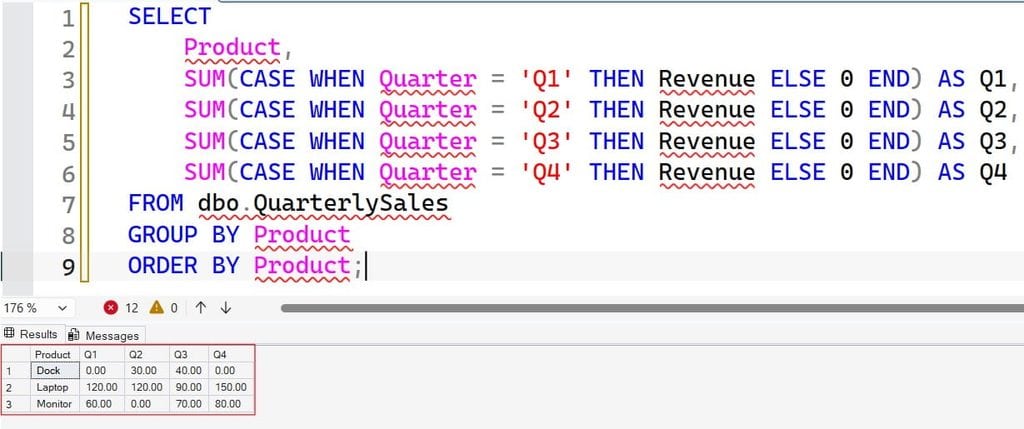
Each CASE returns the revenue when the row belongs to that quarter and 0 otherwise. SUM adds them up per product. The ELSE 0 gives zeros instead of NULLs. If you leave out ELSE, missing combinations come back as NULL.
PIVOT vs. CASE
| Question | PIVOT | CASE (conditional aggregation) |
|---|---|---|
| Code length for many columns | Shorter | Longer |
| Multiple aggregates (sum and count) | Awkward | Easy |
| Different logic per column | Not possible | Easy |
| Works on all SQL dialects | No (T-SQL and a few others) | Yes |
| Familiar to new teammates | Often unfamiliar | Usually clear |
Both read the table once, so performance is usually similar. I use PIVOT for quick one-aggregate layouts and CASE when a report needs counts, sums, and custom rules side by side. Pick the one your team can maintain.
Pro Tip: In my experience, teams that learn conditional aggregation first rarely need
PIVOT. It handles more cases, and it ports to other databases if you ever migrate.
Method 3: Dynamic Pivot When Columns Change
Both methods above hard-code the headings. That breaks the day a new value appears, such as Q5 or a new region. When the list of values changes, build the column list from the data with dynamic SQL, which means assembling a SQL statement as text and running it at run time. Read more in dynamic SQL.
DECLARE @cols NVARCHAR(MAX), @sql NVARCHAR(MAX);

SELECT @cols = STRING_AGG(CAST(QUOTENAME(Quarter) AS NVARCHAR(MAX)), N', ')
               WITHIN GROUP (ORDER BY Quarter)
FROM (SELECT DISTINCT Quarter FROM dbo.QuarterlySales) AS q;

SET @sql = N'
SELECT Product, ' + @cols + N'
FROM (SELECT Product, Quarter, Revenue FROM dbo.QuarterlySales) AS src
PIVOT (SUM(Revenue) FOR Quarter IN (' + @cols + N')) AS p
ORDER BY Product;';

EXEC sys.sp_executesql @sql;
Step by step:
SELECT DISTINCT Quarterfinds the headings that exist right now.QUOTENAMEwraps each value in brackets and escapes special characters. This is essential for safety and for names with spaces. See QUOTENAME.STRING_AGGjoins the values into a comma-separated list, ordered withWITHIN GROUP. It requires SQL Server 2017 or later and is available in Azure SQL Database. See STRING_AGG. On older versions, theFOR XML PATHtrick is the traditional replacement.sp_executesqlruns the generated statement.
After executing the above query, I got the expected output as shown in the screenshot below.
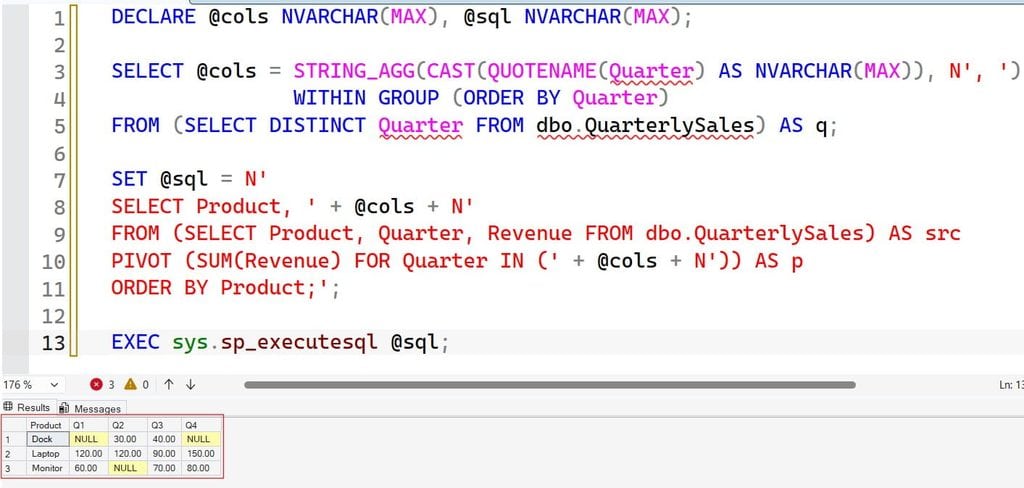
Dynamic SQL carries risks. If any heading value comes from user input, an attacker could try SQL injection, which means slipping extra SQL commands into the text. QUOTENAME neutralizes this for identifiers, but never concatenate raw user input anywhere else in the statement.
Also remember that dynamic SQL does not benefit from ownership chaining, the rule that lets a procedure access tables its owner can access without extra grants. The caller needs permission on the underlying table, or the procedure must use EXECUTE AS.
Wide results have limits too. A result set can hold a large number of columns, but a report with hundreds of dynamic columns is hard to read and slow to render. If the headings number in the dozens, consider doing the final layout in the reporting tool or application.
Pro Tip: I log the generated
@sqltext to a debug table during testing. Seeing the exact statement makes dynamic pivot bugs obvious in seconds, instead of staring at a string in a debugger.
Pivot Dates and Months
Real reports often pivot dates. Raw dates make poor headings, because every day would become a column. Convert them to a month or a quarter first:
SELECT Product,
       SUM(CASE WHEN MONTH(SaleDate) = 1 THEN Revenue ELSE 0 END) AS Jan,
       SUM(CASE WHEN MONTH(SaleDate) = 2 THEN Revenue ELSE 0 END) AS Feb,
       SUM(CASE WHEN MONTH(SaleDate) = 3 THEN Revenue ELSE 0 END) AS Mar
FROM dbo.DailySales
WHERE SaleDate >= '2026-01-01' AND SaleDate < '2026-04-01'
GROUP BY Product;
This assumes a DailySales table with a SaleDate column. The date filter uses a half-open range, which includes January 1 and excludes April 1, and it keeps the column bare so SQL Server can use an index. For month functions, see getting the month from a date. For the full date-pivot pattern, read pivoting a date column.
Turn Rows Into a Single Column
Sometimes “rows into columns” means joining many rows into one text value, such as a comma-separated list of tags. That is a different task. Use STRING_AGG:
SELECT Product, STRING_AGG(Quarter, ', ') WITHIN GROUP (ORDER BY Quarter) AS QuartersSold
FROM dbo.QuarterlySales
GROUP BY Product;
This returns lines such as “Q1, Q1, Q2, Q3, Q4” for Laptop. Use SELECT DISTINCT in a subquery if you want each quarter once. The result is text, so you can no longer aggregate it, which is why this approach suits display and exports more than analysis.
Performance, Indexing, and Reuse
A pivot reads the source rows once, groups them, and spreads values across columns. The cost depends mostly on how many rows you scan, not on the pivot itself. To keep it fast:
- Filter first. Restrict by date or tenant in the source subquery so you pivot fewer rows.
- Index the grouping and filter columns. An index on
(Product, Quarter)that includesRevenuelets SQL Server read a narrow structure. See how to create an index in SQL Server. Check the actual execution plan first, because each index slows inserts and updates. - Pre-aggregate large tables. For hundreds of millions of rows, keep a summary table updated nightly and pivot that instead.
- Use a CTE for clarity. A common table expression names an intermediate step; compare it with a temp table in CTE vs. temp table.
Save the final query in a view or a stored procedure so every report uses the same layout; see SQL Server views and creating a stored procedure. For more tuning ideas, see SQL query optimization tips. In Azure SQL Database, use Query Store, which records query run times, to confirm that a change helped.
Pro Tip: In my experience, the best pivot optimization is a date filter. Pivoting five years of history to show the last quarter wastes compute, which on serverless Azure SQL Database also wastes money.
Frequently Asked Questions
How do I convert rows into columns in SQL Server?
Use the PIVOT operator, or use GROUP BY with SUM(CASE WHEN ... THEN ... END) for each new column. Both turn distinct values from one column into column headings and aggregate a value column into the cells.
What is the difference between PIVOT and CASE for pivoting?
PIVOT is shorter for one aggregate across many columns. CASE is more flexible because you can use several aggregates and custom logic per column, and it works in most SQL dialects. Performance is usually similar.
How do I pivot when I do not know the column values in advance?
Build the column list from the data with STRING_AGG and QUOTENAME, assemble a dynamic PIVOT statement, and run it with sp_executesql. Validate inputs, and remember that the caller needs permission on the underlying table.
Why does my PIVOT return duplicate rows or too many rows?
The source includes extra columns, such as an ID, and PIVOT groups by all of them. Select only the row identifier, pivot column, and value column in a subquery.
How do I show zero instead of NULL in a pivot?
Wrap each pivoted column in COALESCE(column, 0), or use ELSE 0 inside the CASE expressions. Decide whether zero is accurate, since NULL can mean no data and zero means no sales.
You learned how to convert rows into columns in SQL Server with PIVOT, conditional aggregation, and dynamic SQL, and how to handle NULLs, hidden grouping columns, and changing headings. Select only the columns the pivot needs, protect dynamic SQL with QUOTENAME, and give report users read-only access through a view. I hope you found this article helpful.
You May Also Like
- SQL Server string split into rows
- Converting JSON to a table in SQL Server
- How to group by date in SQL Server
- How to use the COUNT function in SQL Server
- SQL cheat sheet

After working for more than 15 years in the Software field, especially in Microsoft technologies, I have decided to share my expert knowledge of SQL Server. Check out all the SQL Server and related database tutorials I have shared here. Most of the readers are from countries like the United States of America, the United Kingdom, New Zealand, Australia, Canada, etc. I am also a Microsoft MVP. Check out more here.